A World Health Organization Essential Medicine, ketamine is widely used at varying doses for sedation, pain control, general anesthesia and as a therapy for treatment-resistant depression. While scientists know its target in brain cells and have observed how it affects brain-wide activity, they haven’t known entirely how the two are connected. A new study by a research team spanning four Boston-area institutions uses computational modeling of previously unappreciated physiological details to fill that gap and offer new insights into how ketamine works.
“This modeling work has helped decipher likely mechanisms through which ketamine produces altered arousal states as well as its therapeutic benefits for treating depression,” said co-senior author Emery N. Brown, Edward Hood Taplin Professor of Computational Neuroscience and Medical Engineering at The Picower Institute for Learning and Memory at MIT, as well as an anesthesiologist at MGH and a Professor at Harvard Medical School.
The researchers from MIT, Boston University, Massachusetts General Hospital and Harvard University said the predictions of their model, published May 20 in Proceedings of the National Academy of Sciences, could help physicians make better use of the drug.
“When physicians understand what's mechanistically happening when they administer a drug, they can possibly leverage that mechanism and manipulate it,” said study lead author Elie Adam, a Research Scientist at MIT who will soon join the Harvard Medical School faculty and launch a lab at MGH. “They gain a sense of how to enhance the good effects of the drug and how to mitigate the bad ones.”
Blocking the door
The core advance of the study involved biophysically modeling what happens when ketamine blocks the “NMDA” receptors in the brain’s cortex—the outer layer where key functions such as sensory processing and cognition take place. Blocking the NMDA receptors modulates the release of excitatory neurotransmitter glutamate.
When the neuronal channels (or doorways) regulated by the NMDA receptors open, they typically close slowly (like a doorway with a hydraulic closer that keeps it from slamming), allowing ions to go in and out of neurons, thereby regulating their electrical properties, Adam said. But, the channels of the receptor can be blocked by a molecule. Blocking by magnesium helps to naturally regulate ion flow. Ketamine, however, is an especially effective blocker.
Blocking slows the voltage build-up across the neuron’s membrane that eventually leads a neuron to “spike,” or send an electrochemical message to other neurons. The NMDA doorway becomes unblocked when the voltage gets high. This interdependence between voltage, spiking and blocking can equip NMDA receptors with faster activity than its slow closing speed might suggest. The team’s model goes further than ones before by representing how ketamine’s blocking and unblocking affect neural activity.
“Physiological details that are usually ignored can sometimes be central to understanding cognitive phenomena,” said co-corresponding author Nancy Kopell, a professor of math at BU. “The dynamics of NMDA receptors have more impact on network dynamics than has previously been appreciated.”
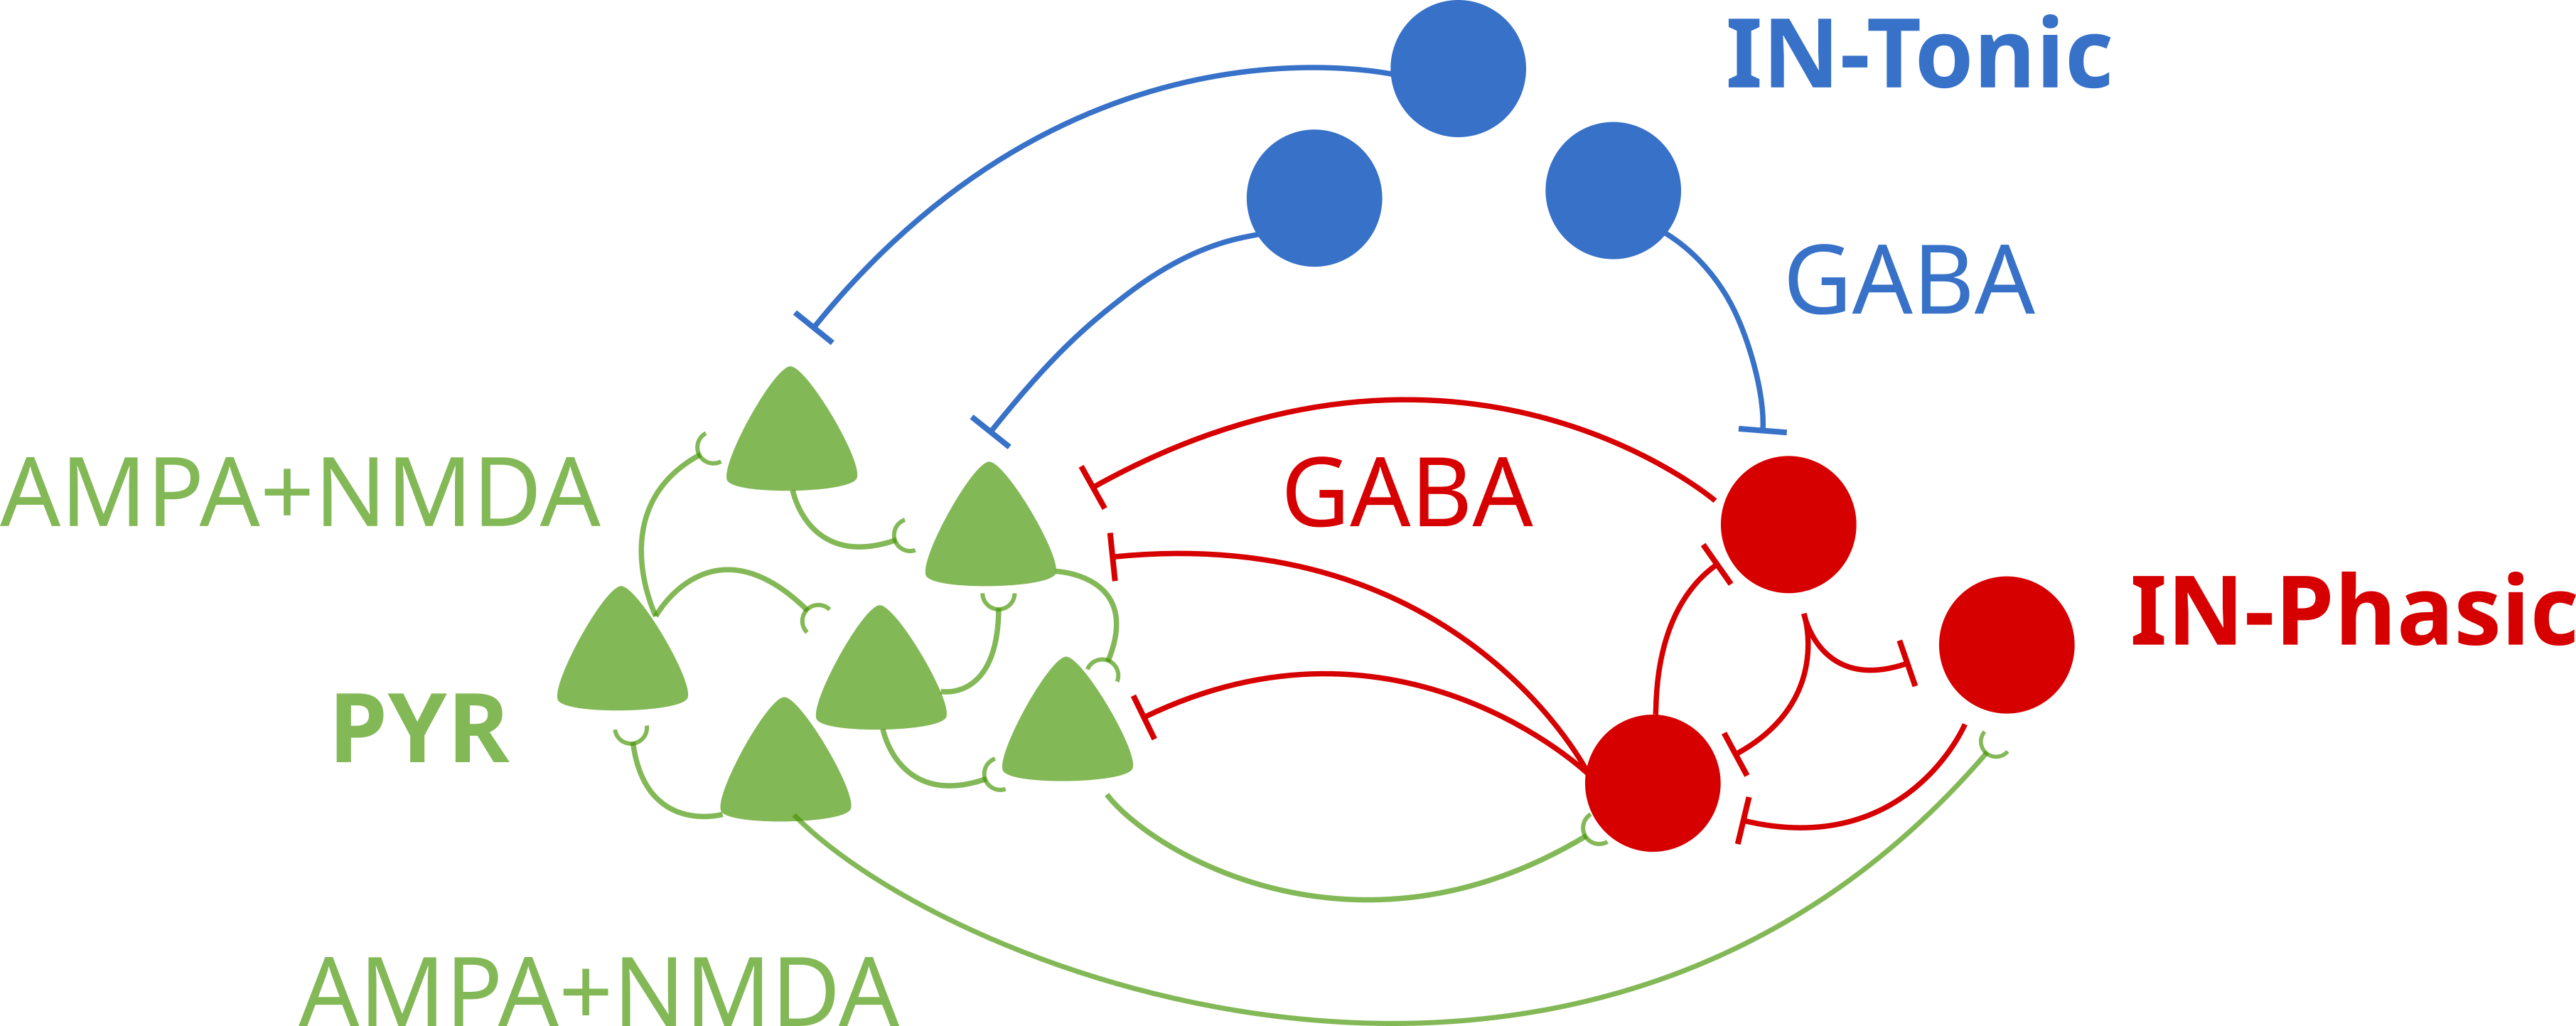
With their model, the scientists simulated how different doses of ketamine affecting NMDA receptors would alter the activity of a model brain network. The simulated network included key neuron types found in the cortex: one excitatory type and two inhibitory types. It distinguishes between “tonic” interneurons that tamp down network activity and “phasic” interneurons that react more to excitatory neurons.
The team’s simulations successfully recapitulated the real brain waves that have been measured via EEG electrodes on the scalp of a human volunteer who received various ketamine doses and the neural spiking that has been measured in similarly treated animals that had implanted electrode arrays. At low doses, ketamine increased brain wave power in the fast gamma frequency range (30-40 Hz). At the higher doses that cause unconsciousness, those gamma waves became periodically interrupted by “down” states where only very slow frequency delta waves occur. This repeated disruption of the higher frequency waves is what can disrupt communication across the cortex enough to disrupt consciousness.
But how? Key findings
Importantly, through simulations, they explained several key mechanisms in the network that would produce exactly these dynamics.
The first prediction is that ketamine can disinhibit network activity by shutting down certain inhibitory interneurons. The modeling shows that natural blocking and unblocking kinetics of NMDA-receptors can let in a small current when neurons are not spiking. Many neurons in the network that are at the right level of excitation would rely on this current to spontaneously spike. But when ketamine impairs the kinetics of the NMDA receptors, it quenches that current, leaving these neurons suppressed. In the model, while ketamine equally impairs all neurons, it is the tonic inhibitory neurons that get shut down because they happen to be at that level of excitation. This releases other neurons, excitatory or inhibitory from their inhibition allowing them to spike vigorously and leading to ketamine’s excited brain state. The network’s increased excitation can then enable quick unblocking (and reblocking) of the neurons’ NMDA receptors, causing bursts of spiking.
Another prediction is that these bursts become synchronized into the gamma frequency waves seen with ketamine. How? The team found that the phasic inhibitory interneurons become stimulated by lots of input of the neurotransmitter glutamate from the excitatory neurons and vigorously spike, or fire. When they do, they send an inhibitory signal of the neurotransmitter GABA to the excitatory neurons that squelches the excitatory firing, almost like a kindergarten teacher calming down a whole classroom of excited children. That stop signal, which reaches all the excitatory neurons simultaneously, only lasts so long, ends up synchronizing their activity, producing a coordinated gamma brain wave.
“The finding that an individual synaptic receptor (NMDA) can produce gamma oscillations and that these gamma oscillations can influence network-level gamma was unexpected,” said co-corresponding author Michelle McCarthy, a research assistant professor of math at BU. “This was found only by using a detailed physiological model of the NMDA receptor. This level of physiological detail revealed a gamma time scale not usually associated with an NMDA receptor.”
So what about the periodic down states that emerge at higher, unconsciousness-inducing ketamine doses? In the simulation, the gamma-frequency activity of the excitatory neurons can’t be sustained for too long by the impaired NMDA-receptor kinetics. The excitatory neurons essentially become exhausted under GABA inhibition from the phasic interneurons. That produces the down state. But then, after they have stopped sending glutamate to the phasic interneurons, those cells stop producing their inhibitory GABA signals. That enables the excitatory neurons to recover, starting a cycle anew.
Antidepressant connection?
The model makes another prediction that might help explain how ketamine exerts its antidepressant effects. It suggests that the increased gamma activity of ketamine could entrain gamma activity among neurons expressing a peptide called VIP. This peptide has been found to have health promoting effects, such as reducing inflammation, that last much longer than ketamine’s effects on NMDA receptors. The research team proposes that the entrainment of these neurons under ketamine could increase the release of the beneficial peptide, as observed when these cells are stimulated in experiments. This also hints at therapeutic features of ketamine that may go beyond anti-depressant effects. The research team acknowledges, however, that this connection is speculative and awaits specific experimental validation.
“The understanding that the sub cellular details of the NMDA receptor can lead to increased gamma oscillations was the basis for a new theory about how ketamine may work for treating depression,” Kopell said.
Additional co-authors of the study are Marek Kowalski, Oluwaseun Akeju, and Earl K. Miller.
The JPB Foundation, The Picower Institute for Learning and Memory, The Simons Center for The Social Brain, the National Institutes of Health, George J. Elbaum (MIT ’59, SM ’63, PhD ’67), Mimi Jensen, Diane B. Greene (MIT, SM ’78), Mendel Rosenblum, Bill Swanson, and annual donors to the Anesthesia Initiative Fund supported the research.


