
May 6, 2021
Anesthestic drugs act on the brain but most anesthesiologists rely on heart rate, respiratory rate, and movement to infer whether surgery patients remain unconscious to the desired degree. In a new study, a research team based at MIT and Massachusetts General Hospital shows that a straightforward artificial intelligence approach, attuned to the kind of anesthetic being used, can yield algorithms that assess unconsciousness in patients based on brain activity with high accuracy and reliability.
“One of the things that is foremost in the minds of anesthesiologists is ‘Do I have somebody who is lying in front of me who may be conscious and I don’t realize it?’ Being able to reliably maintain unconsciousness in a patient during surgery is fundamental to what we do,” said senior author Emery N. Brown, Edward Hood Taplin Professor in The Picower Institute for Learning and Memory and the Institute for Medical Engineering and Science at MIT, and an anesthesiologist at MGH. “This is an important step forward.”
More than providing a good readout of unconsciousness, Brown added, the new algorithms offer the potential to allow anesthesiologists to maintain it at the desired level while using less drug than they might administer when depending on less direct, accurate and reliable indicators. That can improve patient’s post-operative outcomes, such as delirium.
“We may always have to be a little bit ‘overboard’,” said Brown, who is also a professor at Harvard Medical School. “But can we do it with sufficient accuracy so that we are not dosing people more than is needed?”
Used to drive an infusion pump, for instance, algorithms could help anesthesiologists precisely throttle drug delivery to optimize a patient’s state and the doses they are receiving.
Artificial intelligence, real-world testing
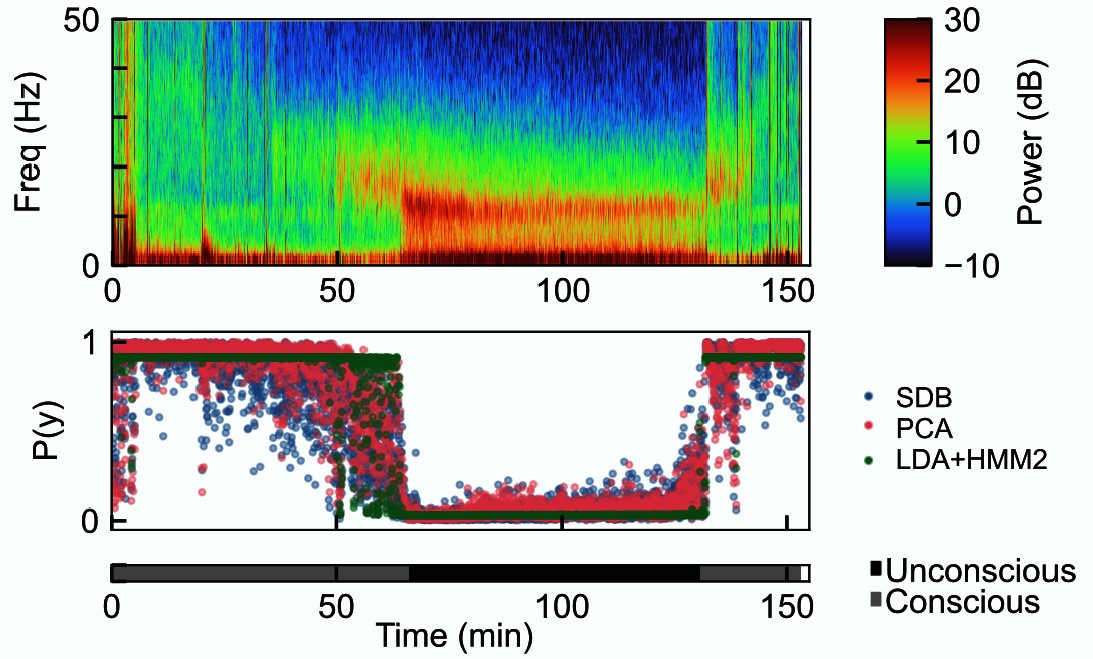
To develop the technology to do so, postdocs John Abel and Marcus Badgeley led the study, published in PLOS ONE, in which they trained machine learning algorithms on a remarkable data set the lab gathered back in 2013. In that study, 10 healthy volunteers in their 20s underwent anesthesia with the commonly used drug propofol. As the dose was methodically raised using computer controlled delivery, the volunteers were asked to respond to a simple request until they couldn’t anymore. Then when they were brought back to consciousness as the dose was later lessened, they became able to respond again. All the while, neural rhythms reflecting their brain activity were recorded with electroencephalogram (EEG) electrodes, providing a direct, real-time link between measured brain activity and exhibited unconsciousness.
In the new work, Abel, Badgeley and the team trained versions of their AI algorithms, based on different underlying statistical methods, on more than 33,000 two-second-long snippets of EEG recordings from seven of the volunteers. This way the algorithms could “learn” the difference between EEG readings predictive of consciousness and unconsciousness under propofol. Then the researchers tested the algorithms in three ways.
First, they checked whether their three most promising algorithms accurately predicted unconsciousness when applied to EEG activity recorded from the other three volunteers of the 2013 study. They did.
Then they used the algorithms to analyze EEG recorded from 27 real surgery patients who received propofol for general anesthesia. Even though the algorithms were now being applied to data gathered from a “noisier” real-world surgical setting where the rhythms were also being measured with different equipment, the algorithms still distinguished unconsciousness with higher accuracy than other studies have shown. The authors even highlight one case in which the algorithms were able to detect a patient’s decreasing level of unconsciousness several minutes before the actual attending anesthesiologist did, meaning that if it had been in use during the surgery itself, it could have provided an accurate and helpful early warning.
As a third test, the team applied the algorithms to EEG recordings from 17 surgery patients who were anesthetized with sevoflurane. Though sevoflurane is different from propofol and is inhaled rather than infused, it works in a similar manner, by binding to the same GABA-A receptors on the same key types of brain cells. The team’s algorithms again performed with high, though somewhat reduced accuracy, suggesting that their ability to classify unconsciousness carried over reliably to another anesthetic drug that works in a similar way.
The ability to predict unconsciousness across different drugs with the same mechanism of action is key, the authors said. One of the main flaws with current EEG-based systems for monitoring consciousness, they said, is that they don’t distinguish among drug classes, even though different categories of anesthesia drugs work in very different ways, producing distinct EEG patterns. They also don’t adequately account for known age differences in brain response to anesthesia. These limitations on their accuracy have also limited their clinical use.
In the new study, while the algorithms trained on 20-somethings applied well to cohorts of surgery patients whose average age skewed significantly older and varied more widely, the authors acknowledge that they want to train algorithms distinctly for use with children or seniors. They can also train new algorithms to apply specifically for other kinds of drugs with different mechanisms of action. All together a suite of well trained and attuned algorithms could provide high accuracy that accounts for patient age and the drug in use.
Abel said the team’s approach of framing the problem as a matter of predicting consciousness via EEG for a specific class of drugs made the machine learning approach very simple to implement and extend.
“This is a proof of concept showing that now we can go and say let’s look at an older population or let’s look at a different kind of drug,” he said. “Doing this is simple if you set it up the right way.”
The resulting algorithms aren’t even computationally demanding. The authors noted that for a given 2 seconds of EEG data, the algorithms could make an accurate prediction of consciousness in less than a tenth of a second running on just a standard MacBook Pro computer.
The lab is already building on the findings to refine the algorithms further, Brown said. He said he also wants to expand testing to hundreds more cases to further confirm their performance, and also to determine whether wider distinctions may begin to emerge among the different underlying statistical models the team employed.
In addition to Brown, Abel and Badgeley, the paper’s other authors are Benyamin Meschede-Krasa, Gabriel Schamberg, Indie Garwood, Kimaya Lecamwasam, Sourish Chakravarty, David Zhou, Matthew Keating and Patrick Purdon.
Funding for the study came from the National Institutes of Health, The JPB Foundation, A Guggenheim Fellowship for Applied Mathematics, and Massachusetts General Hospital.


