March 14, 2022
As the brain strives to hold information in mind, such as the list of groceries we need to buy on the way home, a new study suggests that the most consistent and reliable representation of that information is not the electrical activity of the individual neurons involved but an overall electric field they collectively produce.
Indeed, whenever neuroscientists have looked at how brains represent information in working memory, they’ve found that from one trial to the next, even when repeating the same task, the participation and activity of individual cells varies (a phenomenon called “representational drift”). In a new study in NeuroImage, scientists at The Picower Institute for Learning and Memory at MIT and the University of London found that regardless of which specific neurons were involved, the overall electric field that was generated, provided a stable and consistent signal of the information the animals were tasked to remember.
In a sense, once established, the field imposes itself on the neurons like the conductor of an orchestra in which each neuron is a single musician, said Dimitris Pinotsis, the study’s lead and corresponding author. Even if the musicians change, the conductor still coordinates whomever is in the chairs to produce the same result.
“This ensures that the brain can still function even if some neurons die,” said Pinotsis, an associate professor at University of London and a research affiliate in The Picower Institute at MIT. “The field ensures the same output of the ensemble of neurons is achieved even after individual parts change. The brain does not need individual neurons, just the conductor, the electric field, to be the same.”
Co-author Earl Miller, Picower Professor of Neuroscience in MIT’s Department of Brain and Cognitive Sciences, said electric fields may therefore offer the brain a level of information representation and integration that is more abstract than the level of individual details encoded by single neurons or circuits.
“The brain can employ this mechanism to operate on a more holistic level even as details drift,” he said.
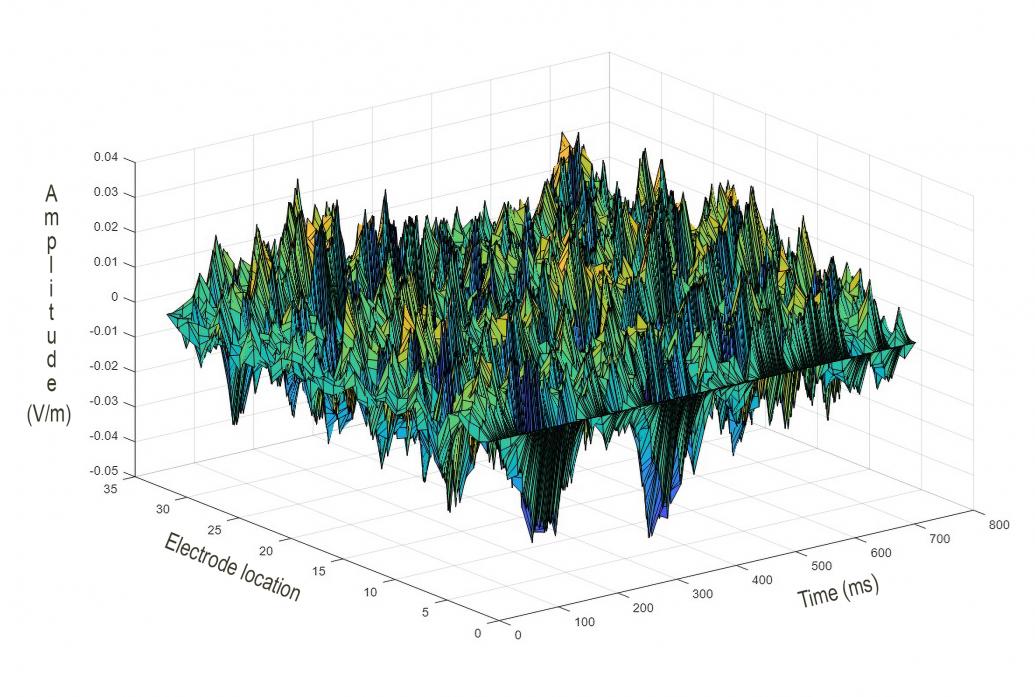
Above: Estimated amplitude of a neural electric field at each electrode over an 800 millisecond time frame. Image by Dimitris Pinotsis.
Measurements and mathematical modeling
In the study, Pinotsis and Miller tested whether the electric field was stable and if it contained information related to the task. To do this they used a combination of direct measurements of neural activity made in animals as they performed a working memory game, and subsequent mathematical analysis to isolate and estimate the electric fields associated with the task. It was not possible to just measure the electric fields directly, Miller said, because the implanted electrode arrays they used measure neural activity individually and EEG electrodes that sit on the outside of the skull pick up patterns that are much too broad and general to reflect the specific information represented by a small ensemble of neurons.
“You have to record each detail and then take the needed half-step up mathematically,” Miller said.
During the game the animals were shown a dot in one of six positions on the edge of a screen that would then go blank. After a brief pause, or delay period, they would then have to direct their gaze from the screen’s center to the position they just saw marked. During the pause, while the animals had to hold the cued direction in mind, Pinotsis and Miller were recording the electrical activity of neurons on the surface of the brain.
“The fields were ‘above’ the brain, but still ‘of’ the brain.”
As expected there was a lot of noise in the signal, even when comparing rounds of the game where the position to be remembered was the same. First of all, consistent with representational drift, the participation of individual neurons varied, but also the electrodes picked up activity not only from neurons involved in the task but also from cells that were working on unrelated things.
So, to isolate game-related patterns among this inconsistent jumble of neural activity, Pinotsis developed a mathematical strategy of tracking correlated activity among the neurons during the delay period. By determining which neurons were working together and cohesively to perform the task, he could determine their connectivity and therefore the information flow among them. From there, using standard principles of biophysics, he calculated the electric field their activity was producing around the patches of brain surface they occupied.
As Miller quipped, “The fields were ‘above’ the brain, but still ‘of’ the brain.”
Importantly, the estimated electric fields exhibited properties demonstrating that they represented the information the animals were holding in memory. For instance, they were more consistent than underlying neural activity was when the direction to be remembered was the same. They also differed in distinct but consistent ways based on which cued position was to be remembered – more so than the neural activity did. And when the scientists trained software called a “decoder” to guess which direction the animals were holding in mind, the decoder was relatively better able to do it based on the electric fields than based on the neural activity.
This is not to say that the variations among individual neurons is meaningless noise, Miller said. The thoughts and sensations of people and animals experience, even as they repeat the same tasks, can change minute by minute, leading to different neurons behaving differently than they just did. The important thing for the sake of accomplishing the memory task is that the overall field remains consistent in its representation.
“This stuff that we call representational drift or noise may be real computations the brain is doing, but the point is that at that next level up of electric fields, you can get rid of that drift and just have the signal,” Miller said.
The researchers hypothesize that the field even appears to be a means the brain can employ to sculpt information flow to ensure the desired result. By imposing that a particular field emerge, it directs the activity of the participating neurons.
Indeed, that’s one of the next questions the scientists are investigating: Could electric fields be a means of controlling neurons?
“We are now using this work to ask whether information flows from the macroscale level of the electric field down to the microscale level of individual neurons,” Pinotsis says. “To make the analogy with the orchestra, we are now using this work to ask whether a conductor’s style changes the way an individual member of an orchestra plays her instrument.”
UK Research and Innovation, the Office of Naval Research and the JPB Foundation provided support for the research.


